Grafana dashboards v2
The examples/grafana/dashboards-v2/ folder contains an advanced dashboard
set for usage, cache behavior and cost analysis.
What is new in v2
- AI navigation flow between overview and drilldown dashboards.
- Input split between
inputandcache_read, visible in both counters and model tables. - Better visibility of reported cloud cost versus equivalent cost and savings when usage runs locally.
- Expanded model dashboard with token composition, reliability signals and price table by direction.
This makes it easier to justify local inference adoption with measurable token-level and cost-level evidence.
Screenshots
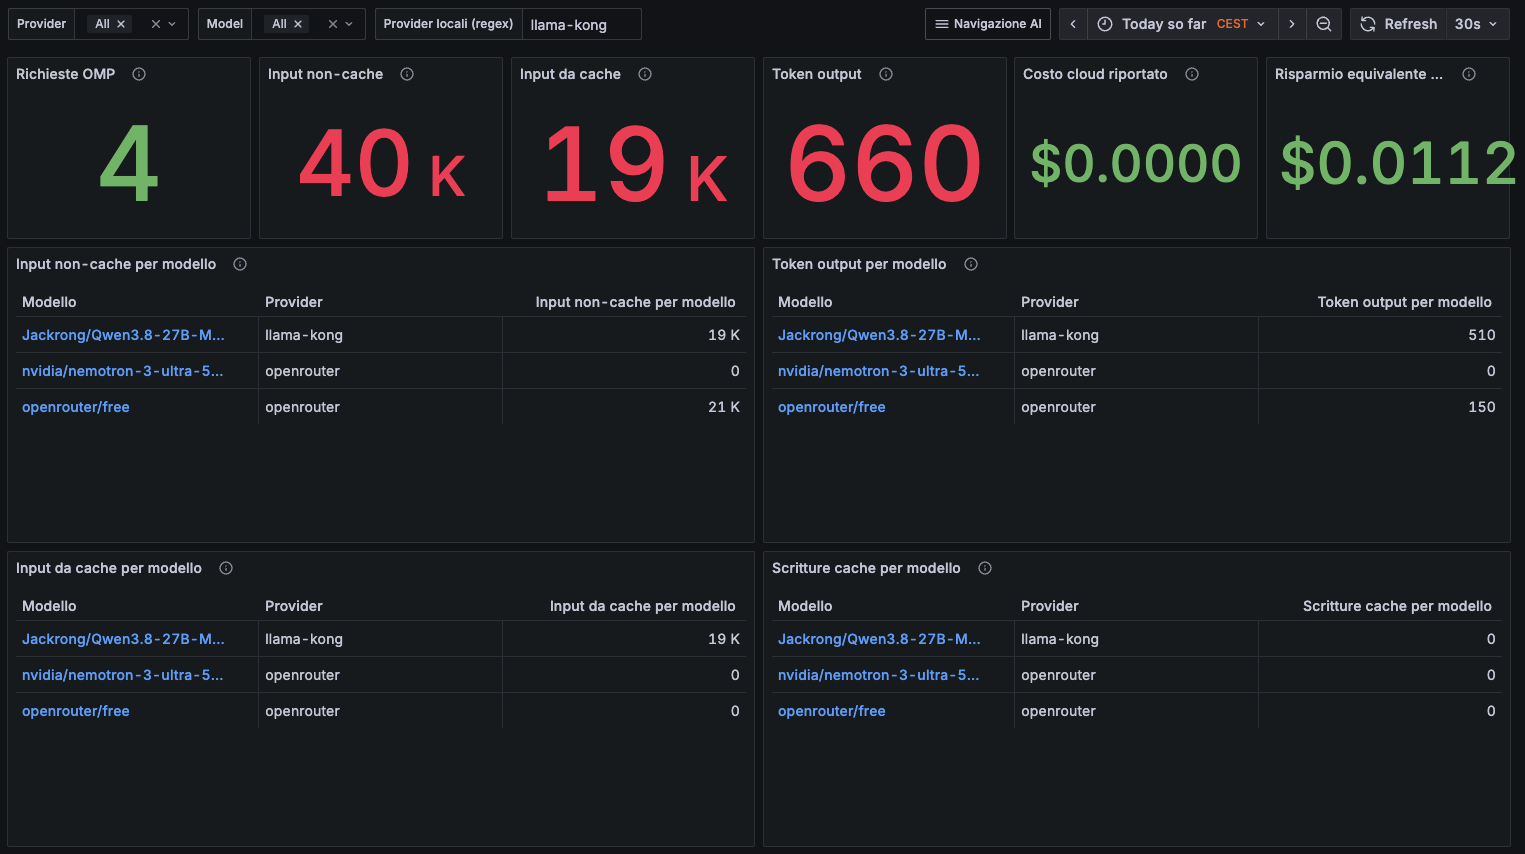
1) AI overview (v2)
The overview surfaces requests, non-cache input, cache input, output tokens, reported cloud cost, and equivalent savings in one row.
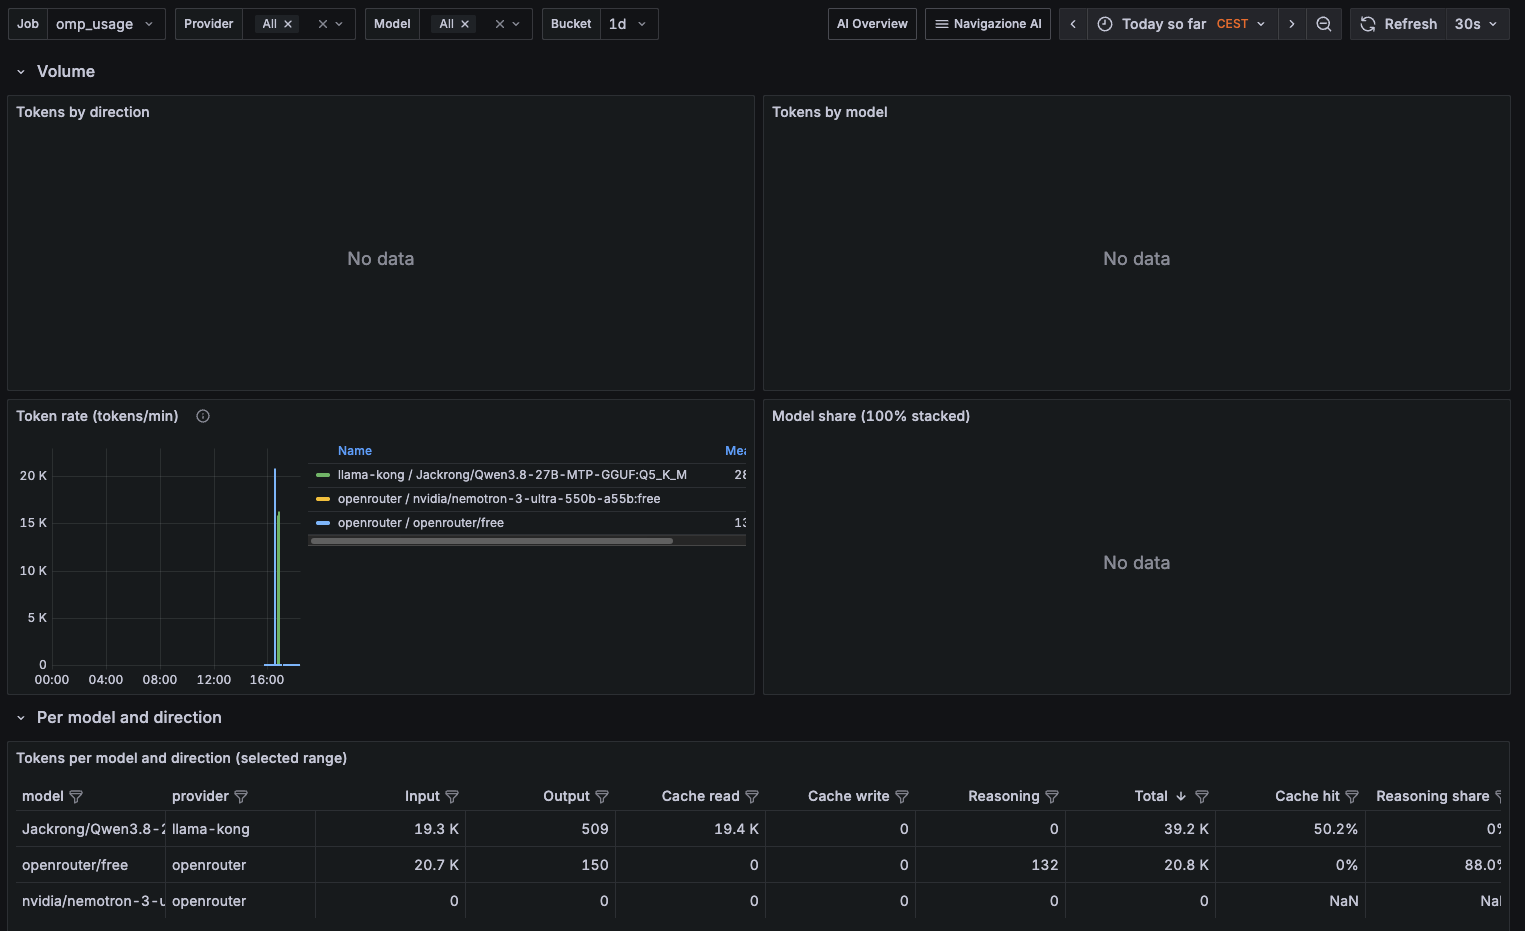
2) Tokens dashboard (v2)
The tokens view adds per-model directional details, including cache read/write and reasoning share.
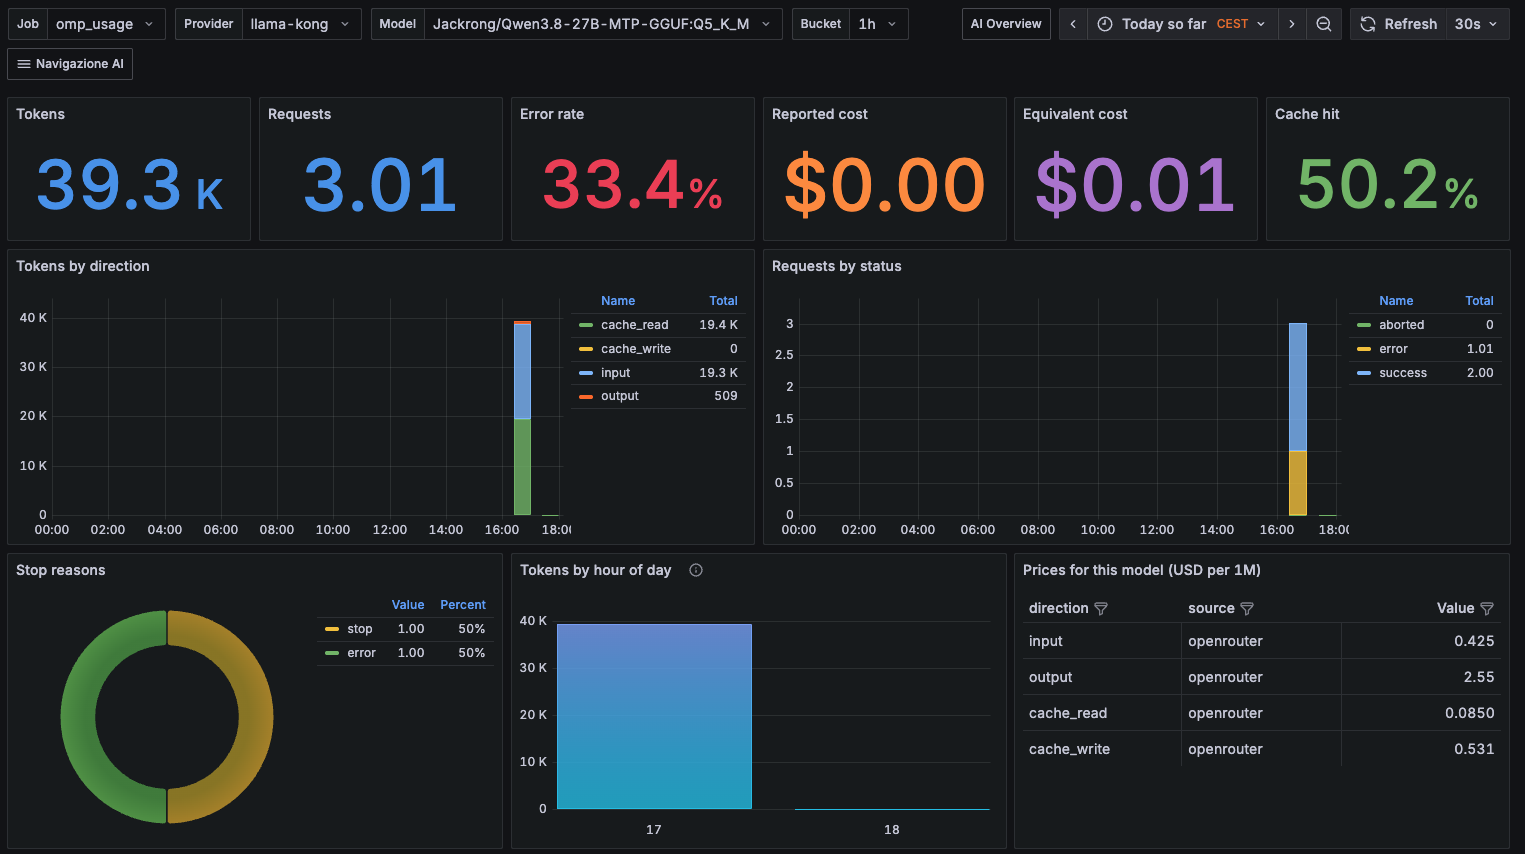
3) Model dashboard (v2)
The model drilldown combines token direction mix, request status, stop reasons, hourly distribution and directional prices for that model.
Provisioning
Use the same Grafana provider file documented in Grafana, but
mount examples/grafana/dashboards-v2/ into
/var/lib/grafana/dashboards/omp-usage.
services:
  grafana:
    image: grafana/grafana:13.2.3
    volumes:
      - ./omp-usage/examples/grafana/dashboards-v2:/var/lib/grafana/dashboards/omp-usage:ro
      - ./omp-usage/examples/grafana/provisioning/dashboards/omp-usage.yml:/etc/grafana/provisioning/dashboards/omp-usage.yml:ro