omp-usage
OMP usage tracking plugin and Prometheus exporter for Oh My Pi.
Dashboard highlights (v2)
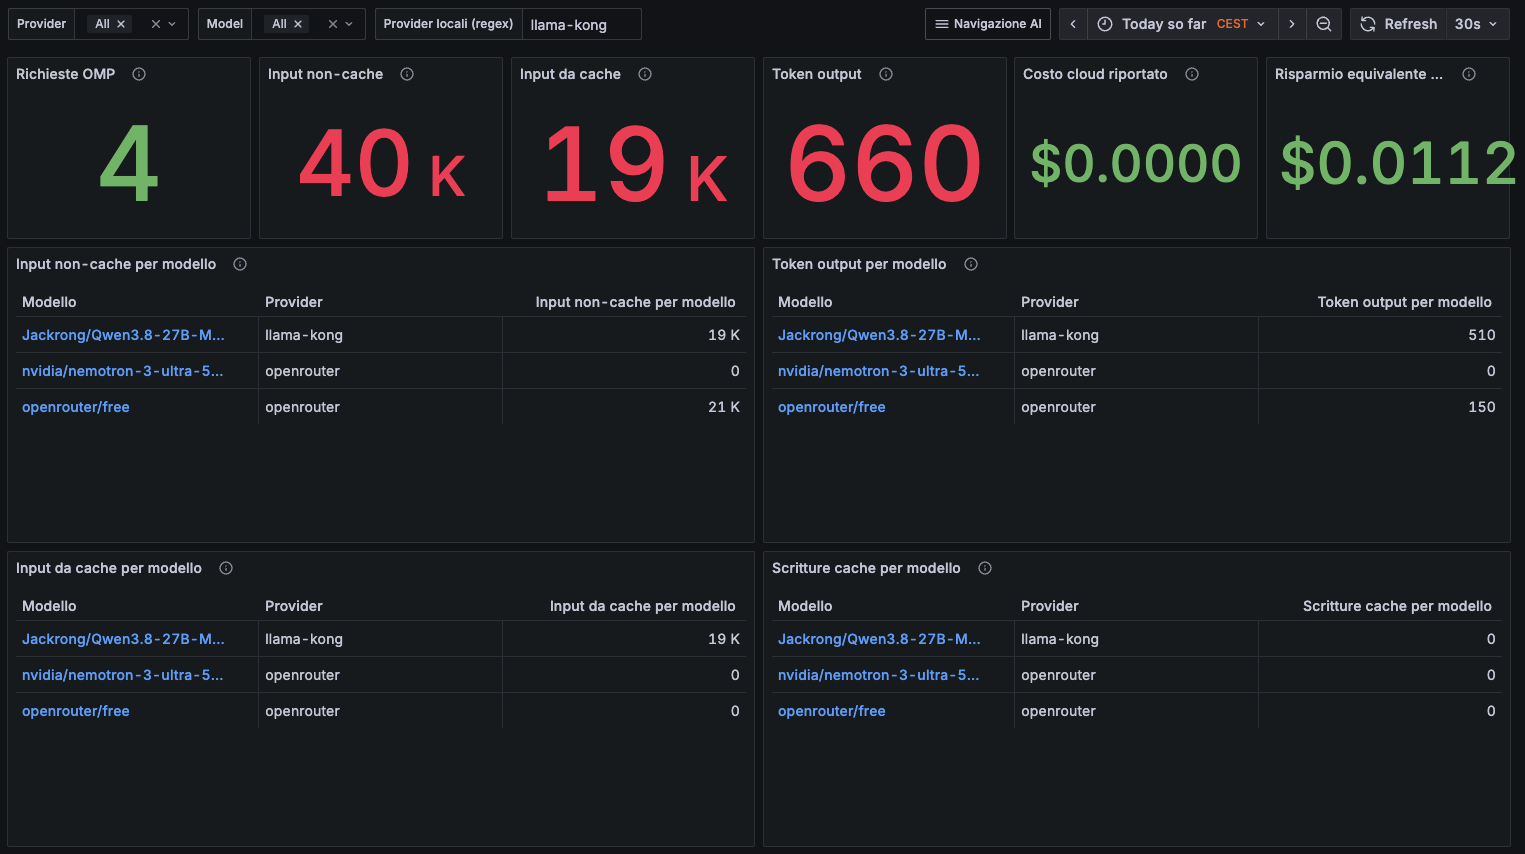
The advanced dashboard bundle in examples/grafana/dashboards-v2/ adds:
- Input split between non-cache and cache-read counters.
- Clear separation between reported cloud cost and equivalent cost.
- A practical way to estimate savings when running the same model locally.
See Grafana for provisioning and formulas, and Grafana dashboards v2 for screenshots and usage notes.
Overview
This project provides two npm packages:
| Package | Description |
|---|---|
@tommasomarchionni/omp-usage |
OMP plugin that collects usage events |
@tommasomarchionni/omp-usage-exporter |
Node.js service that imports events and exposes Prometheus metrics |
Architecture
┌─────────────┐    JSONL files    ┌─────────────┐    HTTP    ┌─────────────┐
│   OMP       │ ────────────────▶ │  Exporter   │ ─────────▶ │ Prometheus  │
│  (plugin)   │  ~/.local/state/  │  (Node.js)  │  /metrics  │             │
└─────────────┘  omp-usage/events │             │            └─────────────┘
                            ▲      └─────────────┘
                            │
                            │  SQLite
                            ▼
                       ┌─────────────┐
                       │  exporter.db │
                       └─────────────┘
- Plugin: Runs inside OMP, writes one JSONL file per session to a configurable directory. No HTTP calls.
- Exporter: Independent Node.js service. Scans the events directory, imports into SQLite, serves
/metrics. - No direct communication between plugin and exporter.
Quick Start
1. Install the plugin
Install with OMP CLI:
omp plugin install @tommasomarchionni/omp-usage
omp plugin list
Then ensure your OMP configuration includes:
{
  "omp": {
    "extensions": ["@tommasomarchionni/omp-usage"]
  }
}
2. Run the exporter
npx @tommasomarchionni/omp-usage-exporter
The exporter starts on http://127.0.0.1:9464 with:
GET /metrics— Prometheus metricsGET /healthz— Health check
3. Configure Prometheus
scrape_configs:
  - job_name: omp_usage
    static_configs:
      - targets: ['exporter.example.internal:9464']
4. Import the Grafana dashboards
See Grafana and Grafana dashboards v2.
Metrics
| Metric | Type | Labels |
|---|---|---|
omp_llm_tokens_total |
Counter | provider, model, direction |
omp_llm_reasoning_tokens_total |
Counter | provider, model |
omp_llm_requests_total |
Counter | provider, model, status |
omp_llm_reported_cost_usd_total |
Counter | provider, model |
omp_llm_usage_missing_total |
Counter | provider, model |
Plus operational metrics: import errors, invalid records, last import timestamp.
Requirements
- Node.js 20+ (LTS)
- OMP 18.8.6+ (tested)
- SQLite (via
better-sqlite3, native build required)
License
MIT © Tommaso Marchionni